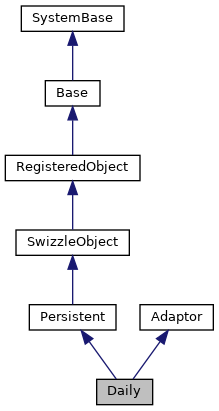
This class is a Daily summary of the detail PerfData and SysData collections. More...


Static Public Member Functions | |
| _.Library.Status | Export (_.Library.String FileName, _.Library.TimeStamp Start, _.Library.TimeStamp End, _.Library.String Class, _.Library.String Function, _.Library.String Database) |
| This class is a Daily summary of the detail PerfData and SysData collections. More... | |
| _.Library.Integer | Purge (_.Library.String Date) |
| Purge Summary data. More... | |
Public Attributes | |
| DB | |
| Database metrics. More... | |
| DateTime | |
| Time of summary. More... | |
| Perf | |
| Performance metrics. More... | |
| PerfCount | |
| Number of Performance samples in this Daily period. More... | |
| Sys | |
| System Usage metrics. More... | |
| SysCount | |
| Number of SystemUsage samples in this Daily period. More... | |
| WD | |
| WriteDaemon metrics. More... | |
| WDCount | |
| Number of WriteDaemon cycles in this Daily period. More... | |
| ZDATE | |
| UTC date key. More... | |
| ZTIME | |
| UTC time key. More... | |
This class is a Daily summary of the detail PerfData and SysData collections.
For each class sample collected you may chose to have the Average, Maximum, Minimum, Median, Standard Deviation, and Total maintained for the day. By default Average, Maximum, and Standard Deviation are kept. Use the SetSummary method in each individual class (Performance, SystemUsage, etc.) to modify this. Performance counters (SYS.History.Performance) are normalized to a per-second rate for all the calculations.
This data can be manually purged using the Purge() method.
For details, see History Monitor.
|
static |
This class is a Daily summary of the detail PerfData and SysData collections.
For each class sample collected you may chose to have the Average, Maximum, Minimum, Median, Standard Deviation, and Total maintained for the day. By default Average, Maximum, and Standard Deviation are kept. Use the SetSummary method in each individual class (Performance, SystemUsage, etc.) to modify this. Performance counters (SYS.History.Performance) are normalized to a per-second rate for all the calculations.
This data can be manually purged using the Purge() method.
For details, see History Monitor.
Export Daily data for a time range in CSV format. The default is all of the
Perf, Sys and WD data currently in the Daily class.
The default FileName is HistoryDay_config_date_time.csv in the MGR directory.
'Start' and 'End' times (if necessary) are in YYYY-MM-DD HH:MM:SS format.
'Class' can be a comma-delimited list one or more of these classes of metrics: "Perf", "Sys", "WD". Or it can be "DB" to select the Database properties. The Database class can not be mixed with the other classes since it uses a different key structure to accommodate multiple databaes.
'Function' can be a comma-delimited list one or more of these summary functions: "Avg", "Max", "Min", StDev", Med" or "Tot". The default is to include all summary functions.
'Database' can be used to select a specific database (by name). Only used if "DB" is selected in 'Class'
|
static |
Purge Summary data.
Purge all days prior to the 'Date' parameter (in YYYY-MM-DD format).
Returns the number of days purged.
| DB |
Database metrics.
| DateTime |
Time of summary.
| Perf |
Performance metrics.
| PerfCount |
Number of Performance samples in this Daily period.
| Sys |
System Usage metrics.
| SysCount |
Number of SystemUsage samples in this Daily period.
| WD |
WriteDaemon metrics.
| WDCount |
Number of WriteDaemon cycles in this Daily period.
| ZDATE |
UTC date key.
| ZTIME |
UTC time key.