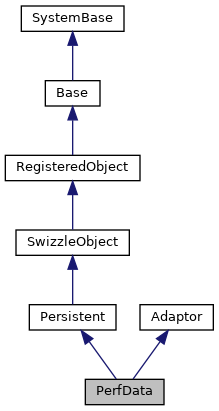
Basic detail collection class of Performance metrics for the Monitor History database. More...


Static Public Member Functions | |
| _.Library.Status | Export (_.Library.String FileName, _.Library.TimeStamp Start, _.Library.TimeStamp End) |
| Export PerfData data for time range in CSV format. More... | |
| _.Library.Integer | Purge (_.Library.Integer Keep) |
| Purge PerfData interval data, keeping the last 'Keep' days. More... | |
| SYS.History.PerfData | Sample () |
| Instantiate the class and fetch current values for all metric properties. | |
| _.Library.Integer | SetPurge (_.Library.Integer Keep) |
| Set the system parameter for the number of days of detail data to keep. More... | |
| _.Library.Status | Summary (_.Library.Integer Day) |
| Collect summaries of the PerfData metrics for a day into the Hourly/Daily database. More... | |
Public Attributes | |
| DateTime | |
| Time of sample. More... | |
| Length | |
| Length of sample in seconds. More... | |
| Perf | |
| Performance metrics. More... | |
| WD | |
| WriteDaemon metrics. More... | |
| ZDATE | |
| UTC date key. More... | |
| ZTIME | |
| UTC time key. More... | |
Basic detail collection class of Performance metrics for the Monitor History database.
Properties represent metrics which get collected every few seconds by the MONAPP Application Monitor process when the Monitor.System.HistoryPerf class is "active". The values stored for most properties are deltas calculated from the last interval.
For details, see History Monitor.
|
static |
Export PerfData data for time range in CSV format.
The default is all of the data
currently in the PerfData class. Note that Write Daemon cycle properties are exported as the high-water mark for the cycles during an interval.
The default FileName is HistoryPerf_config_date_time.csv in the MGR directory.
'Start' and 'End' times (if necessary) are in YYYY-MM-DD HH:MM:SS format.
|
static |
Purge PerfData interval data, keeping the last 'Keep' days.
This is typically called at
the start of each day from the Monitor.System.HistoryPerf class, using the current system default for 'Keep' (see the SetPurge() method). The 'Keep' argument allows you to over ride the system default (a value of "0" or "" uses the system default)
Returns the number of entries purged.
|
static |
Set the system parameter for the number of days of detail data to keep.
Initial system default is 7 days. Return value is the previous setting, and executing this method with a "" argument will return the current setting without modifying it.
|
static |
Collect summaries of the PerfData metrics for a day into the Hourly/Daily database.
This is typically done automatically by Monitor.System.HistoryPerf at the beginning of each day (for the previous day), but could be called manually if there's a problem.
The 'Day' argument sets the end date of the collection, with the default of "0" being the start of today (i.e. $H+Day), which would collect everything for yesterday. A "-1" would collect the day before yesterday; a "1" would collect today (as much as there is).
| DateTime |
Time of sample.
| Length |
Length of sample in seconds.
| Perf |
Performance metrics.
| WD |
WriteDaemon metrics.
| ZDATE |
UTC date key.
| ZTIME |
UTC time key.