|
IRISLIB database
|


|
|
IRISLIB database
|
|
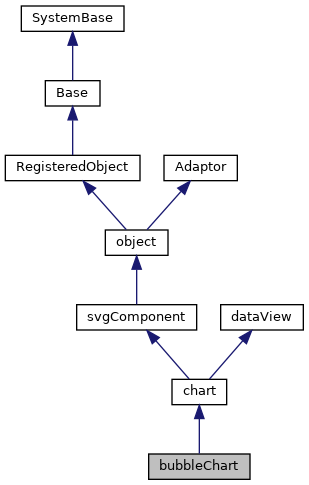
This is an SVG <class>chart</class> component that displays a bubble chart. More...

Public Member Functions | |
| findDataRange () | |
| Internal method: return (as an object) the minimum. More... | |
| getLegendLabels () | |
| Return an array of labels to display within the Legend box. More... | |
| getSeriesNames () | |
| Override and use seriesNames only. | |
| getXAxisTitle () | |
| Return the x axis title. | |
| getXAxisType () | |
| Return the type of x axis (category or value) used by. More... | |
| getYAxisTitle () | |
| Return the y axis title. | |
| getYAxisType () | |
| Return the type of y axis (category or value) used by. More... | |
| renderBands () | |
| Draw the upper/lower bands for the chart. More... | |
| renderSeries (group) | |
| Draw data series for this chart. More... | |
| setProperty (property, value, value2) | |
| Set the value of a named property. | |
 Public Member Functions inherited from chart Public Member Functions inherited from chart | |
| adjustChartTitle () | |
| Adjust position of chart title and legend (if needed). | |
| calculateAxisConstraints () | |
| If the plot has axes, pre-calculate the internal values that will be used. More... | |
| calculateYAxisWidth (which) | |
| Internl method to calculate how much room should be reserved. More... | |
| chartElementClickHandler (evt, series, item) | |
| Mouse click handler for chart elements. More... | |
| computeStyle (className, idName) | |
| Compute and return the effective style that governs the rendering. More... | |
| computeXAxisTimeLine () | |
| Compute scaling information for a time-based x-axis. | |
| createMarker (series, item, x, y, color, type, noevents) | |
| Create a plot marker. More... | |
| createSVGTextNode (caption, fontSize, autoScale, align, rotate, parentNode, txtClass, txtStyle) | |
| Create a text node. | |
| embedStyle (element, styleNVP) | |
| Embed the various settings of a computed style name-value object. More... | |
| formatNumeric (nStr) | |
| Format numeric value. | |
| getChartElement (series, item) | |
| Return the svg object for a specified data element (if any). | |
| getChartElementStyle (series, item) | |
| Return default style for the specified data element (if any). More... | |
| getChartRelatedElements (series, item) | |
| Return an array of related svg objects for a specified data element (if any). More... | |
| getChartSubtitle () | |
| Get subtitle for the chart. | |
| getChartTitle () | |
| Get title for the chart. | |
| getColorSchemeArray (scheme) | |
| Return an array of color values for given data series color scheme. | |
| getComputedFontSize (styleNVP, defaultMedium, defaultSmall, defaultLarge) | |
| Given a resolved style name-value pairing object, return the specified font. More... | |
| getCurrYAxis (which) | |
| Get the current y Axis definition used for this chart. More... | |
| getEndTime () | |
| Get the end time for a time-based chart. | |
| getMarkerShape (series) | |
| Return the marker type that should be used for the given series. | |
| getNumericAbbreviation (val, min, max) | |
| Return a numeric abbreviation for a value. More... | |
| getPelToPixelHRatio () | |
| The Normalized viewbox ranges from 0 0 to 100 100, the physical space. More... | |
| getPelToPixelVRatio () | |
| The Normalized viewbox ranges from 0 0 to 100 100, the physical space. More... | |
| getPlotX (val) | |
| Given a logical value, return the corresponding x-axis. More... | |
| getPlotY (val, yAxisNo) | |
| Given a logical value, return the corresponding y-axis. More... | |
| getRangeGroupForSeries (series) | |
| Indicate which "group" should be used for computing axis ranges. More... | |
| getSelectedItem () | |
| Returns index number (0-based) of the. More... | |
| getSelectedSeries () | |
| Returns index number (0-based) of the data series of the. More... | |
| getSelectedStyle (series, item, isMarker) | |
| Return any additional select/unselect style to apply to a chart element. | |
| getSeriesColor (series) | |
| Return the CSS color that should be used for the given series. | |
| getSeriesCount () | |
| Return the number of data series for this chart. | |
| getSeriesData (series) | |
| Return data values for the given series (0-based) More... | |
| getSeriesSVGGroup () | |
| Return the svg group element that contains the data series elements. | |
| getSeriesSize () | |
| Return the number of items within each data series. More... | |
| getSeriesType (series) | |
| Return the type (how a series should be displayed) for the given data series (0-based). More... | |
| getStartTime () | |
| Get the start time for a time-based chart. | |
| getTimeX (time) | |
| For a given time value, YYYY-MM-DD, find the corresponding x coordinate in virtual pixels. | |
| getXAxis () | |
| Return the x Axis definition for this chart. | |
| getXLabelText (val, base, noformat) | |
| Given a logical value, return the text to use for an axis label. More... | |
| getYAxis (index) | |
| Return the y Axis definition for this chart. More... | |
| getYAxisCount () | |
| Return the number of y Axis definitions for this chart. | |
| getYAxisIndexForSeries (series) | |
| Return the index (0-based) of the y-axis associated with the given data series. More... | |
| getYAxisTitle (which) | |
| Return the y axis title. | |
| getYLabelText (val, yAxisNo, base) | |
| Given a logical value, return the text to use for an axis label. More... | |
| hasAxes () | |
| Indicates that this chart has axes and associated grids. More... | |
| hasMultiples () | |
| Indicates that this chart supports and is in "show multiples" mode. More... | |
| hasSelectedItem () | |
| Returns if there is a current selected element. | |
| integrateStyleSpec (styleNVP, newRule) | |
| Integrate a new Style specification into an existing set of. More... | |
| is3D () | |
| Indicates whether this chart should be drawn with a 3-D. More... | |
| isTimeBased () | |
| Test if a time-based x axis should be used. More... | |
| notifyViewHandler (reason, data1, data2, data3) | |
| Notification that the dataController associated with this dataView. More... | |
| parseStyleSVG (style) | |
| Utility method. More... | |
| pickVerticalSkips (flag, max) | |
| This is the core of the vertical decimation algorithm. More... | |
| plotLineForSeries (group, s, data, stacked, chartFilled, markersVisible, hasEvents) | |
| Draw a line for one data series, s (0-based). More... | |
| prepareAxisGroup (idName, parentNode) | |
| Prepare the axis group for population with axis information. | |
| removeNoDataMsg (plotAreaGroup) | |
| Remove the NoDataMsg from the plot area. | |
| renderAxes () | |
| Draw the x and y axes and grid lines. | |
| renderContents () | |
| Client-side method to render control. | |
| renderLegend () | |
| Draw the legend for the chart. | |
| renderPlotArea () | |
| Draw the plot area of the chart. | |
| renderSeriesGroup () | |
| Draw the data series for this chart. More... | |
| renderTimeEvents (group) | |
| Render a set of time-events within the chart. | |
| renderTitle () | |
| Draw the title for the chart. More... | |
| renderXAxisTimeLine (timeCellGroup, y) | |
| Render x-axis labels and tick marks for time-based x-axis. | |
| renderXAxisTitle (group) | |
| Draw the title section for the Y axis (if any) and. More... | |
| renderXLabels () | |
| Draw the labels for the x axis. | |
| renderYAxisTitle (group, which, xpos) | |
| Draw the title section for the Y axis (if any) and. More... | |
| renderYLabels (which) | |
| Draw the labels for the y axis. | |
| selectElement (series, item) | |
| Select the specified chart element. | |
| setCurrYAxis (axisNo) | |
| Set the current y Axis definition used for this chart. More... | |
| setSizeHandler () | |
| Notification that this component has been resized. | |
| setTimeRange (startTime, endTime, final) | |
| Set the timeline start and end dates and update the chart. More... | |
| setXAxis (axis) | |
| Set the x Axis definition for this chart. More... | |
| setYAxis (axis) | |
| Set the y Axis definition for this chart. More... | |
| showNoDataMsg (msg, plotAreaGroup, clipGroup) | |
| Display the NoDataMsg. More... | |
| updateChart () | |
| Call this method to update contents of this chart. | |
| updateIndicator () | |
| Update the "indicator" (crosshairs) for the selected item. | |
| usePercentForRange () | |
| This method returns true if data series is a "percentage bar chart" and so. More... | |
| useSumForRange () | |
| This method returns true if data series should be summed. More... | |
| xToLogical (val) | |
| Convert a user-provided x-coordinate into 0-100 logical space. More... | |
| yToLogical (val) | |
| Convert a user-provided y-coordinate into 0-100 logical space. More... | |
| Public Member Functions inherited from svgComponent | |
| beginWaitState () | |
| Begin a wait state for this component. More... | |
| calculateViewBox () | |
| Calculate the value of the viewBox attribute of this. More... | |
| clickHandler (evt) | |
| Default mouse click handler. | |
| endWaitState () | |
| End the current wait state for this component. | |
| findSVGElement (subid) | |
| Client-side utility method that finds an SVG element with a. More... | |
| getFrame () | |
| Return the svgFrame object this component belongs to. | |
| getSizeAbsolute () | |
| Return an object containing (as x,y,width, and height properties) More... | |
| refreshContents () | |
| This is not supported for SVG components. | |
| renderSVG (document, parent) | |
| Render the outer SVG enclosing group for this component. More... | |
| setOverlayMode (mode) | |
| Display an overlay for this component to trap mouse events. More... | |
| setPosition (x, y) | |
| Set the x,y position of this component. More... | |
| setPositionHandler () | |
| Notification that this component has been moved. More... | |
| setSize (w, h) | |
| Set the size (width and height) of this component. More... | |
| setTextNode (id, str) | |
| Utility method: More... | |
| sizingMouseDownHandler (evt, which) | |
| Internal: sizing handle mouse down handler. | |
| unrender () | |
| Remove the inner SVG for this component. | |
| wrapMethod (methodName) | |
| Utility method: More... | |
| Public Member Functions inherited from object | |
| _.Library.Status | OnNew (_.Library.RawString initvalue) |
| Constructor for Zen objects. More... | |
| findElement (subid) | |
| Client-side utility method that finds an HTML element with a. More... | |
| fireOnUpdateEvent () | |
| This is called when an object is updated from the server. More... | |
| _.Library.String | getProperty (property, key) |
| Return the value of a named property (i.e. More... | |
| getSettings (settings) | |
| Client-side method that returns a list of this component's. More... | |
| getType () | |
| Returns the component type of this object. More... | |
| invokeSuper (method, args) | |
| Invoke the superclass method method of the current. More... | |
| isOfType (type) | |
| Returns true if this object is of the given component type. More... | |
| makeId (subid) | |
| client-side utility method that constructs a component-specific id More... | |
| onCreate () | |
| This client method, if present, is called when this component is. More... | |
| onDelete () | |
| This client method, if present, is called when this component is. More... | |
| onSerialize () | |
| This client event, if present, is fired before a component. More... | |
| onloadHandler () | |
| This client event, if present, is fired when the page is loaded. | |
| onunloadHandler () | |
| This client event, if present, is fired when the page is unloaded. More... | |
| onupdateHandler () | |
| This client method, if present, is fired when the object is updated from the server. | |
| render () | |
| This causes a component that draws its contents dynamically. More... | |
| Public Member Functions inherited from RegisteredObject | |
| _.Library.Status | OnAddToSaveSet (_.Library.Integer depth, _.Library.Integer insert, _.Library.Integer callcount) |
| This callback method is invoked when the current object is added to the SaveSet,. More... | |
| _.Library.Status | OnClose () |
| This callback method is invoked by the <METHOD>Close</METHOD> method to. More... | |
| _.Library.Status | OnConstructClone (_.Library.RegisteredObject object, _.Library.Boolean deep, _.Library.String cloned) |
| This callback method is invoked by the <METHOD>ConstructClone</METHOD> method to. More... | |
| _.Library.Status | OnNew () |
| This callback method is invoked by the <METHOD>New</METHOD> method to. More... | |
| _.Library.Status | OnValidateObject () |
| This callback method is invoked by the <METHOD>ValidateObject</METHOD> method to. More... | |
| Public Member Functions inherited from Adaptor | |
| _.Library.Status | XMLExport (_.Library.String top, _.Library.String format, _.XML.Namespaces namespaces, attrs, _.Library.String createId, _.Library.String typeAttr, oreflist, idlist, _.Library.String initialIndent, _.Library.Boolean local, _.Net.MIMEPart mimeAttachments) |
| Serialize an XML enabled class as an XML document and write. More... | |
| _.Library.Status | XMLExportToStream (_.Stream.Object export, _.Library.String top, _.Library.String format, _.XML.Namespaces namespaces, attrs, _.Library.String createId, _.Library.String typeAttr, oreflist, idlist, _.Library.String initialIndent) |
| Serialize an XML enabled class as an XML document and appends it to a stream. More... | |
| _.Library.Status | XMLExportToString (_.Library.String export, _.Library.String top, _.Library.String format, _.XML.Namespaces namespaces, attrs, _.Library.String createId, _.Library.String typeAttr, oreflist, idlist, _.Library.String initialIndent) |
| Serialize an XML enabled class as an XML document and write it to a string. More... | |
| Public Member Functions inherited from dataView | |
| _.Library.Status | AcquireDataFromController () |
| Server-side method used by dataView implementation classes to. More... | |
| getController () | |
| Get the dataController component associated with this dataView, if present. More... | |
| sendEventToController (reason, data1, data2, data3) | |
| If connected, send an event to a dataController. More... | |
| setControllerId (id) | |
| Set the controller id for this dataView and establish a connection. More... | |
Public Attributes | |
| lowerLeftStyle | |
| Optional: style applied to the lower left quadrant background. More... | |
| opacity | |
| Default opacity (from 0 to 1) for bubbles. More... | |
| radius | |
| Default radius (in logical units) for bubbles. More... | |
| showQuadrant | |
| If true, then draw background "quadrants". More... | |
| showRegression | |
| If true, then draw a computed linear regression line. More... | |
| upperRightStyle | |
| Optional: style applied to the upper right quadrant background. More... | |
| xCenterValue | |
| Center value along x-axis. More... | |
| yCenterValue | |
| Center value along y-axis. More... | |
| Public Attributes inherited from chart | |
| appearance | |
| Controls the appearance of this chart. More... | |
| autoScaleText | |
| Specifies how the text elements of a chart should be handled when a chart is. More... | |
| axisLineStyle | |
| Optional: style applied to line drawn for x and y axes. More... | |
| axisTitleStyle | |
| Optional: default style applied to axis titles for this chart. More... | |
| backgroundStyle | |
| Optional: style used for chart background panel. More... | |
| bandLower | |
| If defined, then a colored band (specified by <property>bandLowerStyle</property>) More... | |
| bandLowerStyle | |
| Optional: style used for upper band on plot area. More... | |
| bandUpper | |
| If defined, then a colored band (specified by <property>bandUpperStyle</property>) More... | |
| bandUpperStyle | |
| Optional: style used for upper band on plot area. More... | |
| baseLineStyle | |
| Optional: style applied to base line. More... | |
| borderOffset | |
| Optional: distance (in pixels) between the background rectangle and the border. More... | |
| borderRadius | |
| Optional: radius applied to the chart's background rectangle and border. More... | |
| borderStyle | |
| Optional: style used for border line inset from outer edge of chart. More... | |
| currYAxis | |
| Specifies which yAxis definition is used to drive the chart yaxis (0 based). More... | |
| endTime | |
| Latest displayed time (as YYYY-MM-DD HH:MM:SS). More... | |
| gridStyle | |
| Optional: default style applied to all grid line elements for this chart. More... | |
| hasZoom | |
| Optional: if true, display zoom in/out buttons (for certain chart types). More... | |
| indicatorStyle | |
| Optional: style used for indicators. More... | |
| indicatorsVisible | |
| Specifies whether indicator lines should be displayed for the selected item. More... | |
| labelStyle | |
| Optional: default style applied to all grid label elements for this chart. More... | |
| labelsVisible | |
| If true, display axis labels for this chart (or slice labels in the. More... | |
| legendHeight | |
| If this chart has a legend, height (within the chart coordinate space) of legend box. More... | |
| legendLabelStyle | |
| Optional: style used for text within the legend box. More... | |
| legendRectStyle | |
| Optional: style used for rectangle indicating the current legend within the legend box. More... | |
| legendStyle | |
| Optional: style used for background of the legend box. More... | |
| legendTitle | |
| Title to display for legend box. More... | |
| legendVisible | |
| If true, display a legend for this chart. More... | |
| legendWidth | |
| If this chart has a legend, width (within the chart coordinate space) of legend box. More... | |
| legendX | |
| If this chart has a legend, x-position (within the chart coordinate space) of legend box. More... | |
| legendY | |
| If this chart has a legend, y-position (within the chart coordinate space) of legend box. More... | |
| lineStyle | |
| Optional: default style applied to svg line elements within line-style charts. More... | |
| marginBottom | |
| Margin (within the chart coordinate space) from bottom edge of chart to bottom edge of grid (plot area). More... | |
| marginLeft | |
| Margin (within the chart coordinate space) from left edge of chart to left edge of grid (plot area). More... | |
| marginRight | |
| Margin (within the chart coordinate space) from right edge of chart to right edge of grid (plot area). More... | |
| marginTop | |
| Margin (within the chart coordinate space) from top edge of chart to top edge of grid (plot area). More... | |
| markerScale | |
| Scaling applied to chart markers: More... | |
| markerShapes | |
| Comma-delimited list of marker shapes used for data series markers. More... | |
| markerStyle | |
| Optional: style used for series markers. More... | |
| markersVisible | |
| Specifies whether markers should be displayed for the data. More... | |
| maxLabelLen | |
| Maximum number of characters to display for an axis label. More... | |
| msgIfNoData | |
| localized warning message if chart has no data More... | |
| multipleTitleStyle | |
| Optional: style used for title text within each "multiple" charts. More... | |
| noDataFill | |
| color of background rectangle for no data message More... | |
| noDataOpacity | |
| opacity of background rectangle for no data message More... | |
| noDataStroke | |
| color of no data message More... | |
| onelementClick | |
| onelementClick event handler: More... | |
| ongetData | |
| ongetData event handler: More... | |
| ongetLabelX | |
| ongetLabelX event handler: More... | |
| ongetLabelY | |
| ongetLabelY event handler: More... | |
| ongetSeriesColor | |
| ongetSeriesColor event handler: More... | |
| ongetTimeEvents | |
| ongetTimeEvents event handler: More... | |
| onrenderData | |
| onrenderData event handler: More... | |
| onrenderPlotArea | |
| onrenderPlotArea event handler: More... | |
| onshowTooltip | |
| onshowTooltip event handler: More... | |
| plotAreaStyle | |
| Optional: style used for chart plot area panel. More... | |
| plotEdgeStyle | |
| Optional: for charts with a 3D look, this style is applied. More... | |
| plotStyle | |
| Optional: default style applied to svg elements used for plotting. More... | |
| plotToEdge | |
| Specifies how values should be plotted along a category axis. More... | |
| scrollButtonStyle | |
| Optional: style applied to zoom and scroll buttons when visible. More... | |
| selectedItem | |
| Item number (0-based) of currently selected chart element, if any. More... | |
| selectedItemStyle | |
| Optional: style used to indicate the current selected chart element. More... | |
| selectedSeries | |
| Series number (0-based) of currently selected chart element, if any. More... | |
| seriesColorScheme | |
| This is the name of a built-in color scheme used to plot. More... | |
| seriesColors | |
| Comma-delimited list of CSS color values used for data series. More... | |
| seriesColorsOverride | |
| Additional Comma-delimited list of CSS color values used for data series. More... | |
| seriesCount | |
| Number of data series to display on this chart. More... | |
| seriesNames | |
| Comma-delimited list of names used to label each data series in the legend box. More... | |
| seriesNumber | |
| Optional. More... | |
| seriesSize | |
| Number of items within each data series to display on this chart. More... | |
| seriesYAxes | |
| Optional. More... | |
| showMultiples | |
| Optional: If true, display chart as number of small multiple charts, one per data series. More... | |
| startTime | |
| Earliest displayed time (as YYYY-MM-DD HH:MM:SS). More... | |
| stripeStyle | |
| Optional: style used for grid stripes (when enabled). More... | |
| stripesVisible | |
| Optional: if true, draw stripes over value axis grid lines. More... | |
| subtitle | |
| Subtitle to display for chart. More... | |
| subtitleStyle | |
| Optional: style used for subtitle text. More... | |
| textSize | |
| Optional: if "medium", use the default font sizes specified by the CSS for the chart. More... | |
| timeBased | |
| Optional: If true, then the x-axis for this chart is a time line displaying date values. More... | |
| title | |
| Title to display for chart. More... | |
| titleAlign | |
| Optional: alignment for title and subtitle. More... | |
| titleBoxStyle | |
| Optional: style used for box underneath title text. More... | |
| titleImage | |
| Optional: URL of image to display within the title area. More... | |
| titleImageStyle | |
| Optional. More... | |
| titleStyle | |
| Optional: style used for title text. More... | |
| titleX | |
| If this chart has a title, x-position (within the chart coordinate space) of the title. More... | |
| titleY | |
| If this chart has a title, y-position (within the chart coordinate space) of the title. More... | |
| tooltipRectStyle | |
| if non-null used to set style for tool tip rectangle More... | |
| unselectedItemStyle | |
| Optional: style used to indicate unselected chart elements. More... | |
| valueBoxStyle | |
| Optional: style used for boxes around value labels. More... | |
| valueLabelFormat | |
| Optional: numeric format applied to value labels. More... | |
| valueLabelStyle | |
| Optional: style used for value labels. More... | |
| valueLabelsVisible | |
| Specifies whether values should be displayed for elements within the chart. More... | |
| warnIfNoData | |
| Set to 1 to display a localized warning message if chart has no data. More... | |
| xAxis | |
| x axis specification for this chart. More... | |
| yAxis | |
| Deprecated. More... | |
| yAxisList | |
| List of y axis specifications for this chart. More... | |
| Public Attributes inherited from svgComponent | |
| boundless | |
| If true, this component is boundless. More... | |
| document | |
| Client-side property that points to SVG document this component is rendered on. More... | |
| height | |
| Width of this component. More... | |
| hidden | |
| If true, this component is hidden. More... | |
| onclick | |
| onclick event handler: More... | |
| position | |
| If position is "fixed", then this shape will not scroll with its canvas. More... | |
| preserveAspectRatio | |
| Value to apply for this component's enclosing svg element's. More... | |
| svgComponent | |
| Client-side property used to determine if a component is an SVG component. More... | |
| svgGroup | |
| Client-side property that points to the enclosing SVG group element for this component. More... | |
| viewBoxHeight | |
| If defined, this is used to calculate the height of the. More... | |
| viewBoxWidth | |
| If defined, this is used to calculate the width of the. More... | |
| width | |
| Width of this component. More... | |
| x | |
| x position of this component's enclosing group. More... | |
| y | |
| y position of this component's enclosing group. More... | |
| Public Attributes inherited from object | |
| aux | |
| @qualifier final This is an auxiliary property that is provided More... | |
| composite | |
| @qualifier final For components that are created as part of a composite component, More... | |
| id | |
| @qualifier final This is a unique identifier that is used to distinguish this object More... | |
| index | |
| @qualifier final System-assigned index number used internally to identify this component. More... | |
| name | |
| @qualifier final Name of this object. More... | |
| onupdate | |
| onupdate event handler: More... | |
| parent | |
| @qualifier final Link to the component that contains this object More... | |
| tuple | |
| @qualifier final Special property indicating which tuple of a More... | |
| visible | |
| This property indicates whether a component is visible and thus layed out. More... | |
| window | |
| @qualifier final This is a client-only property that refers to the JavaScript More... | |
| Public Attributes inherited from dataView | |
| controller | |
| Internal property. More... | |
| controllerId | |
| Optional. More... | |
| onnotifyView | |
| onnotifyView event handler: More... | |
Static Public Attributes | |
| DEFAULTMARKERSVISIBLE = None | |
| Default value for the markersVisible property. | |
| DEFAULTPLOTTOEDGE = None | |
| Default value for plotToEdge property. | |
| Static Public Attributes inherited from chart | |
| DEFAULTAPPEARANCE = None | |
| Default appearance of this component. | |
| DEFAULTASPECT = None | |
| Do not worry about preserving the aspect ratio. | |
| DEFAULTAUTOSCALETEXT = None | |
| Default setting for autoscaling text as chart resizes. | |
| DEFAULTMARKERSVISIBLE = None | |
| Default value for the markersVisible property. | |
| DEFAULTPLOTTOEDGE = None | |
| Parameter SYSMODULE = "chart";. More... | |
| DEFAULTVALUELABELSVISIBLE = None | |
| Default value for the valueLabelsVisible property. | |
| DEFAULTVIEWBOXHEIGHT = None | |
| Default viewBoxHeight of this component. More... | |
| DEFAULTVIEWBOXWIDTH = None | |
| Default viewBoxWidth of this component. More... | |
| Static Public Attributes inherited from svgComponent | |
| DEFAULTASPECT = None | |
| Subclasses can set this to change the default value for the <property>preserveAspectRatio/<property> property for a component. | |
| DEFAULTBOUNDLESS = None | |
| Subclasses can set this to change the default value for the <property>boundless</property> property for a component. | |
| DEFAULTHEIGHT = None | |
| Default height of this component. | |
| DEFAULTHIDDEN = None | |
| Subclasses can set this to change the default value for the <property>hidden</property> property for a component. | |
| DEFAULTVIEWBOXHEIGHT = None | |
| Default viewBoxHeight of this component. | |
| DEFAULTVIEWBOXWIDTH = None | |
| Default viewBoxWidth of this component. | |
| DEFAULTVISIBLE = None | |
| Subclasses can set this to change default visibilty for a component. | |
| DEFAULTWIDTH = None | |
| Default width of this component. | |
| POSTCOMPILEACTIONS = None | |
| Internal parameter. | |
| Static Public Attributes inherited from object | |
| DEFAULTVISIBLE = None | |
| Subclasses can set this to change default visibilty for a component. | |
| INCLUDEFILES = None | |
| CSV list of additional include files (either .js or .css) that. More... | |
| MODULE = None | |
| If set, this indicates that this system component should be. More... | |
| NAMESPACE = None | |
| This is the XML namespace used for library components. | |
| POSTCOMPILEACTIONS = None | |
| This is a comma-delimited list of which post-compile actions this component. More... | |
| USECOMMONDIRECTORY = None | |
| If true, then the include files generated for this component, are placed in the. More... | |
| XMLFORMAT = None | |
| If XMLFORMAT="Literal", then only support for literal format import and export is generated. More... | |
| XMLIGNOREINVALIDATTRIBUTE = None | |
| By setting this to 0, we disallow use of invalid attribute names in Zen XML documents. | |
| Static Public Attributes inherited from RegisteredObject | |
| CAPTION = None | |
| Optional name used by the Form Wizard for a class when generating forms. More... | |
| JAVATYPE = None | |
| The Java type to be used when exported. | |
| PROPERTYVALIDATION = None | |
| This parameter controls the default validation behavior for the object. More... | |
| Static Public Attributes inherited from Adaptor | |
| ATTRIBUTEQUALIFIED = None | |
| ATTRIBUTEQUALIFIED controls the format of exported XML by controlling whether attributes. More... | |
| ELEMENTQUALIFIED = None | |
| ELEMENTQUALIFIED controls the format of exported XML. More... | |
| NAMESPACE = None | |
| NAMESPACE specifies the XML namespace to be used when projecting the. More... | |
| SUPPRESSTYPEPREFIX = None | |
| SUPPRESSTYPEPREFIX allows the type name that refers to this class. More... | |
| XMLDEFAULTREFERENCE = None | |
| XMLDEFAULTREFERENCE specifies the default value of the XMLREFERENCE property parameter. More... | |
| XMLENABLED = None | |
| If this parameter is true then XML-enabling methods. More... | |
| XMLFORMAT = None | |
| The XMLFORMAT parameter controls the generation of the XMLExport and XMLImport. More... | |
| XMLIGNOREINVALIDATTRIBUTE = None | |
| The XMLIGNOREINVALIDATTRIBUTE parameter allows the programmer to control handling of unexpected. More... | |
| XMLIGNOREINVALIDTAG = None | |
| The XMLIGNOREINVALIDTAG parameter allows the programmer to control handling of unexpected. More... | |
| XMLIGNORENULL = None | |
| XMLIGNORENULL allows the programmer to override the default XML handling. More... | |
| XMLINCLUDEINGROUP = None | |
| XMLINCLUDEINGROUP allows the programmer to control whether a class is included. More... | |
| XMLINHERITANCE = None | |
| If the XMLINHERITANCE parameter is set to "LEFT", then in the case of multiple. More... | |
| XMLNAME = None | |
| This parameter provides the default XMLNAME for the class. More... | |
| XMLNIL = None | |
| The XMLNIL class parameter controls the use of xsi:nil by XMLExport. More... | |
| XMLNILNOOBJECT = None | |
| The XMLNILNOOBJECT parameter allows creation of an object to be skipped for elements. More... | |
| XMLPREFIX = None | |
| The XMLPREFIX parameter controls the prefix to be used for the XML namespace that. More... | |
| XMLSEQUENCE = None | |
| If the XMLSEQUENCE = 1, then the order of the XML elements must match the. More... | |
| XMLSUMMARY = None | |
| The summary fields to be used when an object is referenced are specified. More... | |
| XMLTYPE = None | |
| This parameter provides the default XMLTYPE for the class. More... | |
| XMLUNSWIZZLE = None | |
| If the XMLUNSWIZZLE parameter is set to 1, then single object. More... | |
| XMLUSEEMPTYELEMENT = None | |
| If the XMLUSEEMPTYELEMENT parameter is set to 1, then the empty element shorthand (<tag>) More... | |
Additional Inherited Members | |
| Static Public Member Functions inherited from Adaptor | |
| _.Library.Status | XMLDTD (_.Library.String top, _.Library.String format, _.Library.Boolean input, dtdlist) |
| Write the DTD to the current device for this XML enabled class serialized as. More... | |
| _.Library.RegisteredObject | XMLNew (_.XML.Document document, _.Library.Integer node, _.Library.RegisteredObject containerOref) |
| Get an instance of an XML enabled class. More... | |
| _.Library.Status | XMLSchema (_.Library.String top, _.Library.String format, _.Library.String namespacePrefix, _.Library.Boolean input, _.Library.Boolean refOnly, schema) |
| Write an XML Schema fragment to the current device which describes an XML enabled class and dependent classes. More... | |
| _.Library.String | XMLSchemaNamespace () |
| Get the namespace to which this class belongs for use in schema generation. More... | |
| _.Library.Status | XMLSchemaType (_.XML.Schema schemaInstance, _.XML.Node node, _.Library.String top, _.Library.Boolean encoded, _.Library.Boolean summary, _.Library.Boolean input, _.Library.Boolean refOnly) |
| Add a complexType to the schema that is respresented by an <class>XML.Schema</class> instance. More... | |
This is an SVG <class>chart</class> component that displays a bubble chart.
This chart expects at least 2 data series, the first supplying x values and the second supplying y values.
Additional series are interpreted as:
Series 2: radius (radius of each bubble).
Series 3: colors (items are grouped into buckets by value).
Series 4: opacity (opacity of items from 0 to 1 – values are not normalized).
| findDataRange | ( | ) |
Internal method: return (as an object) the minimum.
and maximum data values for this chart. This is used for ranges that are automatically calculated.
| getLegendLabels | ( | ) |
Return an array of labels to display within the Legend box.
For xy chart we have to skip the first series, as it contains x-values, and not a logical data series.
Reimplemented from chart.
| getXAxisType | ( | ) |
| getYAxisType | ( | ) |
| renderBands | ( | ) |
Draw the upper/lower bands for the chart.
Override standard "bands" and replace with "quadrant" boxes.
Reimplemented from chart.
| renderSeries | ( | group | ) |
Draw data series for this chart.
group is the SVG container for the chart components.
Reimplemented from chart.
| lowerLeftStyle |
Optional: style applied to the lower left quadrant background.
| opacity |
Default opacity (from 0 to 1) for bubbles.
If there is a opacity series, its
values are scaled and multiplied by this value.
| radius |
Default radius (in logical units) for bubbles.
If there is a radius series, its
values are scaled and multiplied by this value.
| showQuadrant |
If true, then draw background "quadrants".
| showRegression |
If true, then draw a computed linear regression line.
| upperRightStyle |
Optional: style applied to the upper right quadrant background.
| xCenterValue |
Center value along x-axis.
Used to draw background "quadrants".
| yCenterValue |
Center value along y-axis.
Used to draw background "quadrants".