|
%SYS
|


|
|
%SYS
|
|
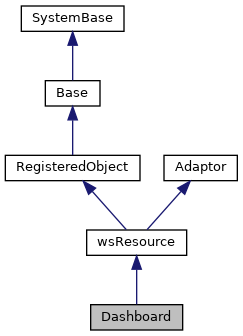
This class provides an overview of the system "health", with all of the critical metrics and statuses gathered as properties in one class. More...

Static Public Member Functions | |
| SYS.Stats.Dashboard | Sample () |
| Instantiate the class and fill in current values for all properties. | |
Public Attributes | |
| ApplicationErrors | |
| Number of application errors that have been logged. More... | |
| CSPSessions | |
| Most recent number of CSP sessions. More... | |
| CacheEfficiency | |
| Most recently measured cache efficiency (Global references / (physical reads + writes)) More... | |
| DatabaseSpace | |
| Indicates whether there is a reasonable amount of diskspace available for database files. More... | |
| DiskReads | |
| Number of physical block read operations since system startup. More... | |
| DiskWrites | |
| Number of physical block write operations since system startup. More... | |
| ECPAppServer | |
| Summary status of ECP application servers connected to this system. More... | |
| ECPAppSrvRate | |
| Most recently measured ECP application server traffic in bytes/second. More... | |
| ECPDataServer | |
| Summary status of ECP data servers this system is connected to. More... | |
| ECPDataSrvRate | |
| Most recently measured ECP data server traffic in bytes/second. More... | |
| GloRefs | |
| Number of Global references since system startup. More... | |
| GloRefsPerSec | |
| Most recently measured number of Global references per second. More... | |
| GloSets | |
| Number of Global Sets and Kills since system startup. More... | |
| JournalEntries | |
| Number of entries written to the system journal since system startup. More... | |
| JournalSpace | |
| Indicates whether there is a reasonable amount of diskspace available for journal files. More... | |
| JournalStatus | |
| Indicates the current status of the database journaling. More... | |
| LastBackup | |
| Date and time of last system backup. More... | |
| LicenseCurrent | |
| Current count of license units being used. More... | |
| LicenseCurrentPct | |
| License usage as a percentage of available license units. More... | |
| LicenseHigh | |
| Highest count of license units used. More... | |
| LicenseHighPct | |
| Highest license usage as a percentage of available license units. More... | |
| LicenseLimit | |
| Maximum allowed license units for this system. More... | |
| LicenseType | |
| Text description of license type for this system. More... | |
| LockTable | |
| Indicates the current status of the system Lock Table based on percentage used. More... | |
| LogicalReads | |
| Number of logical block requests since system startup. More... | |
| Processes | |
| Most recent number of running processes. More... | |
| RouRefs | |
| Number of routine loads and saves since system startup. More... | |
| SeriousAlerts | |
| Number of serious alerts that have been raised. More... | |
| ShadowServer | |
| Summary status of shadows configured on this shadow server. More... | |
| ShadowSource | |
| Summary status of shadow connections on this data source. More... | |
| SystemUpTime | |
| Elapsed time since this system was started. More... | |
| WriteDaemon | |
| Indicates the current status of the system Write Daemon. More... | |
This class provides an overview of the system "health", with all of the critical metrics and statuses gathered as properties in one class.
It essentially contains all of the data that's available on the Dashboard in the System Management Portal. Each property is a different metric or status.
Most of the data is collected by an instance of the Application Monitor running in the SYS namespace. You must have the Monitor.System.Dashboard classes "active" to collect the data (see ^MONAPPMGR for details).
A class may be instantiated by calling the class method 'Sample', and then the current value of each property can be accessed.
For example:
s ref=##class(SYS.Stats.Dashboard).Sample() w ref.GloRefsPerSec ; display number of global references per second
| ApplicationErrors |
Number of application errors that have been logged.
| CSPSessions |
Most recent number of CSP sessions.
| CacheEfficiency |
Most recently measured cache efficiency (Global references / (physical reads + writes))
| DatabaseSpace |
Indicates whether there is a reasonable amount of diskspace available for database files.
Possible values are "Normal", "Warning" (<5MB) or "Troubled" (<2MB)
| DiskReads |
Number of physical block read operations since system startup.
| DiskWrites |
Number of physical block write operations since system startup.
| ECPAppServer |
Summary status of ECP application servers connected to this system.
| ECPAppSrvRate |
Most recently measured ECP application server traffic in bytes/second.
| ECPDataServer |
Summary status of ECP data servers this system is connected to.
| ECPDataSrvRate |
Most recently measured ECP data server traffic in bytes/second.
| GloRefs |
Number of Global references since system startup.
| GloRefsPerSec |
Most recently measured number of Global references per second.
| GloSets |
Number of Global Sets and Kills since system startup.
| JournalEntries |
Number of entries written to the system journal since system startup.
| JournalSpace |
Indicates whether there is a reasonable amount of diskspace available for journal files.
Possible values are "Normal", "Warning" (<250MB) or "Troubled" (<50MB)
| JournalStatus |
Indicates the current status of the database journaling.
Possible values are "Normal", "Disabled", "Suspended", "Frozen", "Paused", "Unknown".
| LastBackup |
Date and time of last system backup.
| LicenseCurrent |
Current count of license units being used.
| LicenseCurrentPct |
License usage as a percentage of available license units.
| LicenseHigh |
Highest count of license units used.
| LicenseHighPct |
Highest license usage as a percentage of available license units.
| LicenseLimit |
Maximum allowed license units for this system.
| LicenseType |
Text description of license type for this system.
| LockTable |
Indicates the current status of the system Lock Table based on percentage used.
Possible values are "Normal", "Warning" (>85%) or "Troubled" (>95%)
| LogicalReads |
Number of logical block requests since system startup.
| Processes |
Most recent number of running processes.
| RouRefs |
Number of routine loads and saves since system startup.
| SeriousAlerts |
Number of serious alerts that have been raised.
| ShadowServer |
Summary status of shadows configured on this shadow server.
Values from SYS.Shadowing class queries.
| ShadowSource |
Summary status of shadow connections on this data source.
Values from SYS.Shadowing class queries.
| SystemUpTime |
Elapsed time since this system was started.
Indicates the current status of the system Write Daemon.
Possible values are "Normal" or "Troubled" (based on lack of movement in queue)