|
%SYS
|


|
|
%SYS
|
|
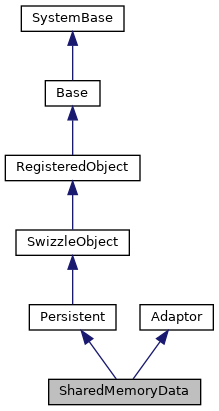
Basic detail collection class of System Usage metrics for the Shared Memory Application Monitor (Monitor.System.HistoryMemory) Properties represent metrics which get collected every few minutes by the MONAPP Application Monitor process when the Monitor.System.HistoryMemory class is "active". More...

Static Public Member Functions | |
| _.Library.Integer | Demo (_.Library.Integer Days, _.Library.Integer Interval) |
| _.Library.Integer | Purge (_.Library.Integer DaysKeep) |
| Report (_.Library.Integer Verbosity, _.Library.Integer StartZD, _.Library.Integer EndZD) | |
| Generate a report that analyses the data that has been previously. More... | |
| SetPurge (_.Library.Integer Keep) | |
Public Attributes | |
| Allocated | |
| Shared Memory Allocated. More... | |
| Available | |
| Shared Memory Available. More... | |
| GSTUsed | |
| General String Table Used. More... | |
| Length | |
| Length of sample in seconds. More... | |
| SMID | |
| System usage metrics. More... | |
| SMTUsed | |
| Static Memory Table Used. More... | |
| TotalGSTSMTAllocated | |
| Total GST and SMT allocated. More... | |
| TotalUsed | |
| Total Memory used. More... | |
| Used | |
| Shared Memory Used. More... | |
| ZDATE | |
| UTC date key. More... | |
| ZTIME | |
| UTC time key. More... | |
Basic detail collection class of System Usage metrics for the Shared Memory Application Monitor (Monitor.System.HistoryMemory) Properties represent metrics which get collected every few minutes by the MONAPP Application Monitor process when the Monitor.System.HistoryMemory class is "active".
|
static |
Create some data for demonstration purposes.
By default this method will create data for a single day assuming a sample interval of 300 seconds, hence it will generate (86400/300) samples.
The method works by finding the current usage of shared memory heap, and then for every sample will randomly increase or decrease the shared memory heap usage for a single consumer, with a bias towards gradually increasing the total SMH usage.
Warning: This will delete all existing data for SMH analysis
|
static |
Purge SharedMemoryData interval data, keeping the last 'DaysKeep' days.
This is typically called at the start of each day from the Monitor.System.HistorySys class, using the current system default for 'Keep' (see the SetPurge() method). The 'DaysKeep' argument allows you to over ride the system default , a value of "0" or "" uses the system default, and a value of -1 deletes everything.
Returns the number of entries purged.
|
static |
Generate a report that analyses the data that has been previously.
captured by the application monitor.
By default the report will include all samples from the table and will simply return a value that is the recommended size of SMH expressed in Kilobytes, which is calculated as the sum of the peak usage of all the shared memory heap consumers with a growth value added (2MB per CPU).
Verbosity The verbosity of the display to the screen, where 0 is the minimum verbosity (no output), 1 displays a summary and 2 displays a breakdown of the different consumers.
StartZD By default the report will include all samples found, but by passing a value here in internal date format, the report will only start from that date
EndZD By default the report will continue until the final sample at the last time and date is found. By passing a value here, which is a date in internal format, the report will stop its analysis at the end of this date.
|
static |
Set the system parameter for the number of days of sample data to keep.
Initial system default is 7 days. Return value is the previous setting, and executing this method with a "" argument will return the current setting without modifying it.
| Allocated |
Shared Memory Allocated.
| Available |
Shared Memory Available.
| GSTUsed |
General String Table Used.
| Length |
Length of sample in seconds.
| SMID |
System usage metrics.
| SMTUsed |
Static Memory Table Used.
| TotalGSTSMTAllocated |
Total GST and SMT allocated.
| TotalUsed |
Total Memory used.
| Used |
Shared Memory Used.
| ZDATE |
UTC date key.
| ZTIME |
UTC time key.